Safe and Soon
February 10, 2024
Growing up as a girl in India, I was often told not to travel alone at night. Being an outgoing and independent person, this often led to fights with my parents. How do I convince them that I’m responsible enough to not go through the shady parts of town? In a society where safety concerns often dictate the choices we make, “Safe and Soon” emerged as a beacon of reassurance for people like me, seeking a secure journey back home. Thus, fueled by a need for freedom and a stubbornness to break stereotypes, I jumped into creating a solution that not only gets you home but changes how we see safety on our trips. And guess what? I got to create a pretty neat prototype using this idea for the Smart India Hackathon 2019 with my awesome team from PES University, that we named “Code Diggers”.
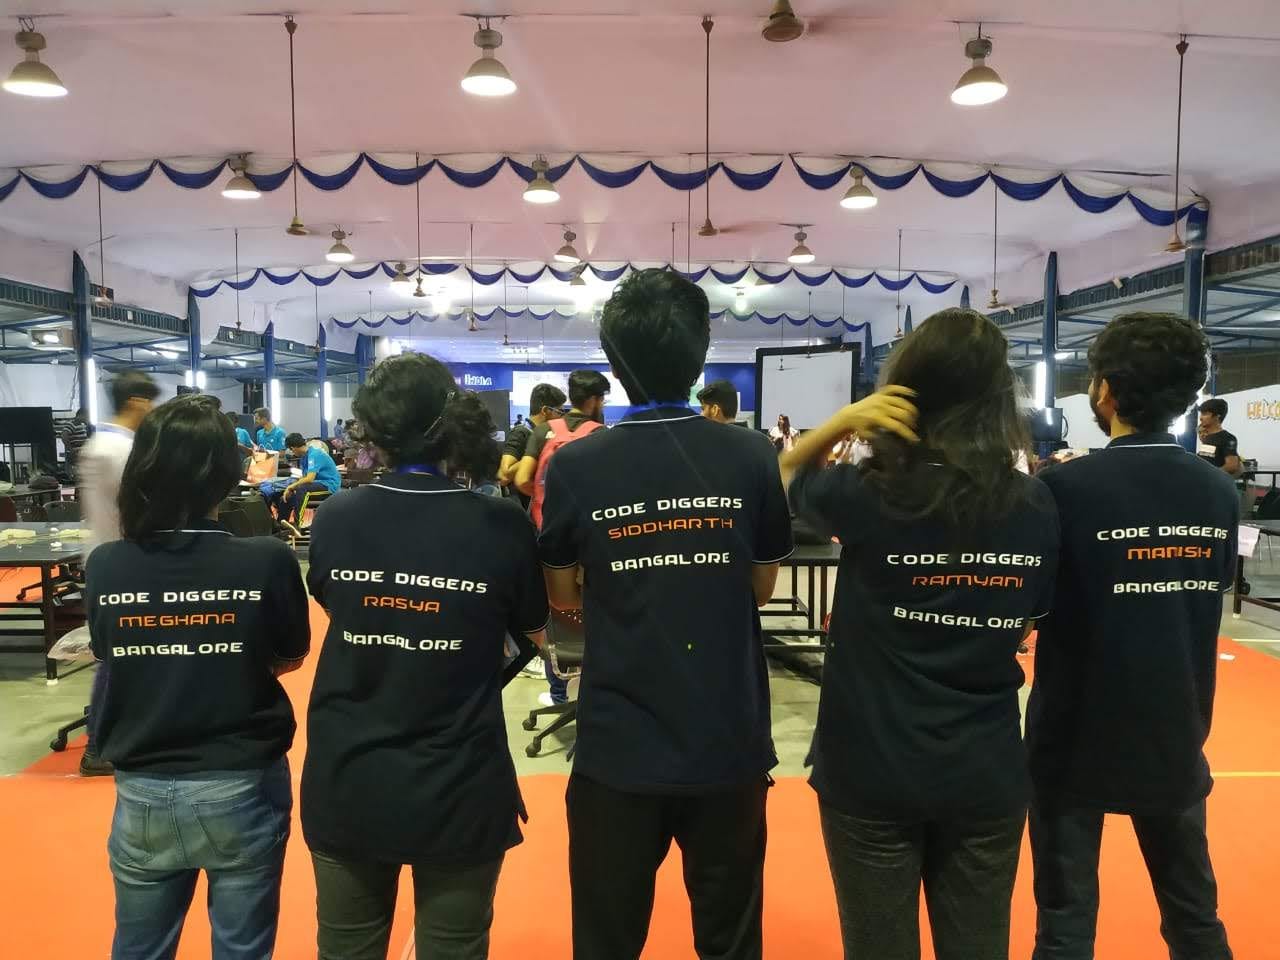
Code Diggers — PES University
The Problem #
So now let’s formally formulate the problem statement. Given two points A and B, we wanted to find the shortest AND safest path between those points. What exactly do we mean by the safest path? At a high level, that means that if we want to go from A to B, we want to get there as fast as we can and avoid as many shady roads, blocks and neighbourhoods as possible.
Designing a Solution #
Now that we had a clear problem statement in mind, we needed to come up with a systematic way to solve this problem. We tried to make a list of all the things we would need to do this. Well, firstly, we’d need a front end or a UI to show the path. We would also need a server to process the requests. These are the easy parts.
Next, we needed to actually solve the core problem. Let’s look at the problem statement again
Given two points A and B, I wanted to find the shortest AND safest path between those points.
We first decided to tackle the shortest path problem. There were several readily available solutions for this. Similar to the approach Google Maps uses, we decided to use a combination of Dijkstra’s and A* algorithms. The heuristic function we used so far was based on the actual distance between point A and point B.
Next, we had to tackle how we were going to solve the “safest” path part. It seemed that we would somehow have to quantify the safety of an area or a road and add that to our heuristic to calculate scores. So, we came up with a strategy. We would classify areas into three different zones — green or “safe” zones, yellow or “iffy” zones, and red or “danger” zones. Then, we would score paths that go across more green zones higher than those that go across yellow or red zones.
Now, the question was, how do we classify these zones? On what basis can we call a zone safe or dangerous? One idea is to classify them based on the frequency of crimes occurring at a place. So, how do we get a reliable source of data to calculate the frequency of crimes at a place?
Challenges in Data Sources #
One approach is to manually create our database. By perhaps conducting a survey, we could have ourselves classified areas into “safe”, “iffy” and “danger” zones. However, there is one major issue with such a design choice. The nature of such databases is often dynamic — some places may be considered safe neighbourhoods at one point in time, but may not be so safe at some other point in the future. This would not just result in our app being useless — this is a potentially dangerous result, as a false positive means we would recommend a path as a safe path, even though it is probably dangerous, lulling the user into a false sense of security.
So, the key question was: How do we constantly keep such a database up to date efficiently? Manually updating this database is certainly not a viable solution. So, we needed to identify a data source which, by nature, kept this information up to date. Our solution to this problem was to use online newspapers as our crime reporters. We scraped the crime section of reliable online newspapers to build our database, specifically extracting the location of the crime and the type of crime from the article. This required a little bit of text processing, but eventually, we were able to create a pretty decently sized database good enough for our hackathon prototype.
The main benefit of such a data source is that we knew we could argue for its scalability. Since news articles constantly report crimes in various parts of the city, we could be sure that we had the latest information on which places were considered safe or unsafe.
Putting It Into Action #
Armed with a dynamic database and a solid algorithmic foundation, we integrated these elements into our “Safe and Soon” app. The front end and server seamlessly interacted to visualize the optimal routes, combining efficiency and safety. Users could now confidently navigate the city, avoiding shady areas and embracing a sense of security on their journeys.
In the interest of time, we built a basic web crawler to crawl for crime information and limited our scope to just the city of Bangalore. But, for future enhancements, we could’ve used other data sources like government databases for police reports, surveys and even perhaps direct input from the app itself.
The Smart India Hackathon 2019 Experience #
In a nutshell, “Safe and Soon” isn’t just about figuring out the quickest way home; it’s about shaking up the safety scene in our cities. We learned a lot during our journey, especially that tackling data integration head-on can be a real puzzle. But you know what? With some good old-fashioned brainpower, we managed to crack the code.
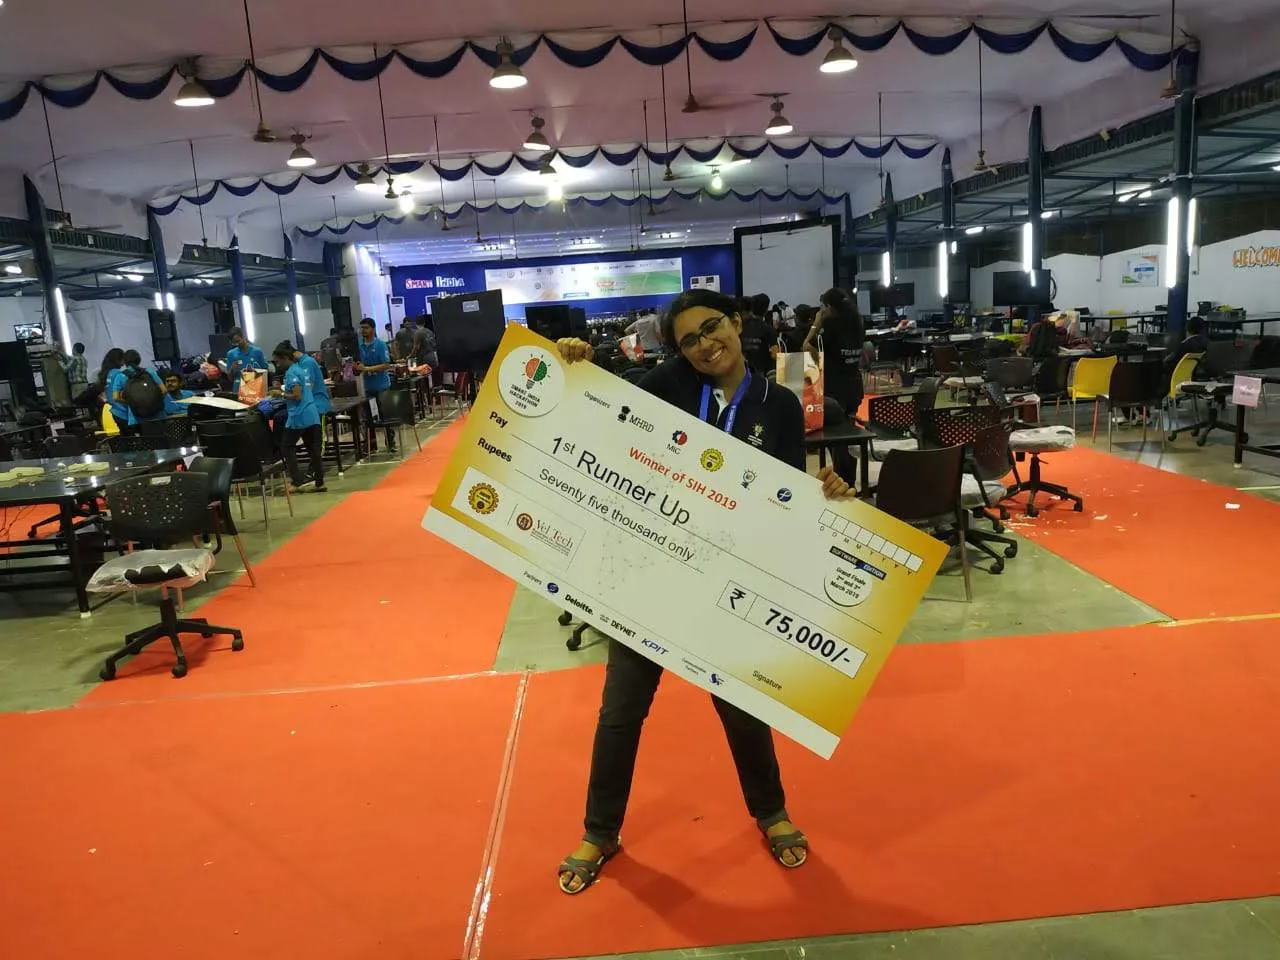
Oh, and did I mention the icing on the cake? We clinched the second spot at the Smart India Hackathon 2019 and walked away with a cool ₹75000 (about $1000 in 2019). The whole experience was not just validating — it sparked a whole new level of enthusiasm for tackling real-world challenges with tech. And of course, it gave me a pretty decent way to convince my parents that I’d survive the night out!